Introducing The Visual in the Noise: All things data and visualisation
Inspirations, data analysis, datasets, tutorials, and reviews of data and visualisation tools - straight into your inbox.
Welcome to The Visual in the Noise.
Data is everywhere and growing at an exponential rate along with the volume of media coverage about “big data”, data science and AI. The proliferation of AI has impacted many fields such as medical diagnostics, facial recognition or virtual personal assistants.
Still, in most cases it remains a human requirement to gather the data, view it, process it, understand it, and most importantly - communicate the findings.
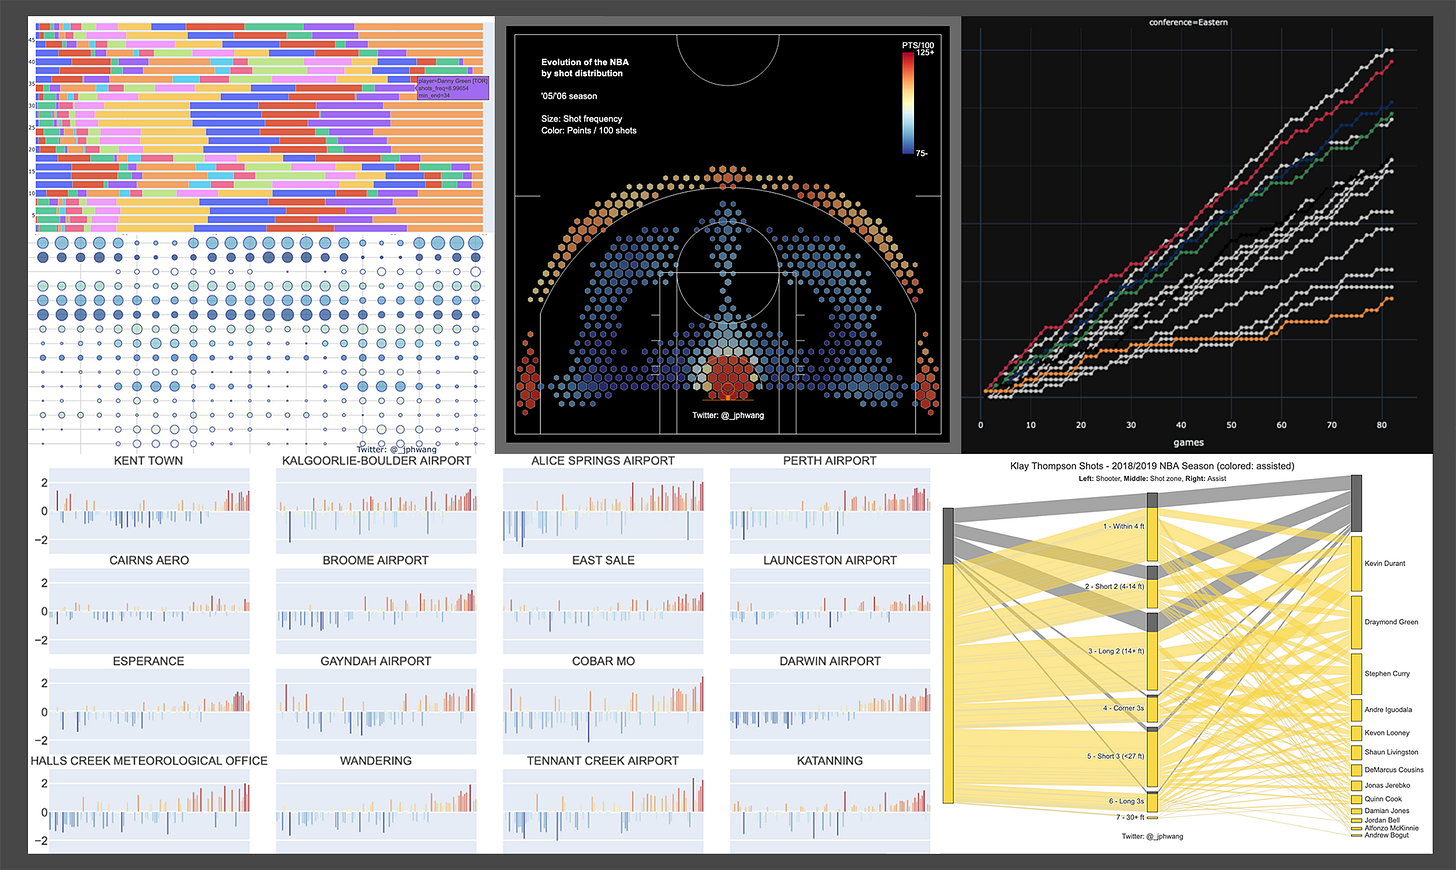
This is why data analysis and visualisation still remain critical skills and will continue to be. This Substack is all about those two aspects - data analysis to view, process and understand the data, and visualisations like these to help explore the data and then to communicate the key findings.
This Substack will be home to:
Coding tutorials on all things data - from analysis, visualisation, interactivity, all the way to deployment.
Inspirational visualisations from around the Internet (& code to recreate them).
Interesting, real-world datasets to explore.
Reviews of data tools - including everything from software packages like D3.js, Plotly.py, Bokeh or FastAPI, to SaaS like DataWrapper or AirTable.
I’m so excited for this project and look forward to connecting with you all.
Sign up now so you don’t miss the first issue.
In the meantime, tell your friends!


