The case for consistency metrics in sports
There's ample evidence that consistency, or variance, is important in sports. Then why is it that we aren't measuring it?
Welcome to this issue of V/N!
This week’s main article looks at the link between consistency and wins in sports. It’s something I’ve been thinking about for a while as a sports fan / data nerd. Even though we often talk about consistency in sports, most of the statistical look at teams or players are through the aggregate or average stats only.
So I wondered - are we regularly ignoring an important piece of data in evaluating teams and players? I would love to get your thoughts and comments on this - so please sound off on comments or let me know on Twitter!
The right angle to look at wins
Let’s start with the Pythagorean. Not the mathematical theorem describing right-angled triangles, but the far more esoteric empirical formula for predicting a team’s win percentage in baseball.
The Pythagorean correlates a team’s win percentage for a season based on its aggregate runs scored and runs allowed over a season. It looks like this:
As you might have guessed, it is named the “Pythagorean” for its similarity to the mathematical theorem. The next chart shows it in action by plotting the actual win percentage vs Pythagorean predictions in baseball over the last 40 years.
The blue markers denote results from an individual team’s season, and the black line shows where the markers would be if the Pythagorean formula matched the actual wins exactly. The formula is a demonstrably effective approximation of actual outcomes.
The Pythagorean is also applicable in other sports, provided that different exponents are used. An exponent of 2.37 is said to be the best-fit number for the NFL, and 13.91 was developed as the number for basketball by a certain Daryl Morey in the early 90s.
As to why it exists, sometimes the Pythagorean is used to estimate how many games a team “should” have won, and determine if they got “lucky”, or “unlucky”. It might be then used to guess which team is likely to regress back to the mean.
But why are these exponents different?
Intuition behind the Pythagorean
For an intuitive understanding, let’s see how win estimates change as exponents change. Here is a chart plotting Pythagorean expectations (Y-axis, as a win %) as a function of the run ratio (X-axis) and the exponent (colour).
Notice how the shape of the lines change along with the exponent. The chart shows that for the same ratio of runs allowed and scored, a higher exponent leads to a higher win percentage.
If that’s too abstract, imagine that a team has scored 50% more points than it has allowed throughout its season. That would give that team a run ratio of 2/3, or 0.67. Now take a look at each curve, and the corresponding win %.
In baseball where the exponent is 1.83, such a team would be expected to win about 67% of its games. In football (exponent of 2.37), it would win 72%. In basketball (exponent of 13.91), it would basically win all of its games (99.6%).
The intuition of the Pythagorean exponent, then, is to represent the variance, or randomness, inherent in the sport. The higher the exponent, less chance a similarly worse team has of winning a given game.
So if differences in variance across sports affect teams’ wins in each sports for similar performances, does variance affect wins at a team level within a sport?
Winning and consistency
If there is a systematic impact of consistency on wins, it should show up as differences between predicted Pythagorean predictions and actual wins. So we can test if offensive consistency and defensive consistency show correlations with Pythagorean errors (actual wins minus predictions).
The below chart shows the relationship for offences only (runs scored), plotting difference between actual wins and Pythagorean wins on the Y-axis, and a measure of consistency (standard deviation) X-axis.
And the same chart, for defences:
Both of these charts show correlations between consistency and extra wins vs prediction. Statistically, correlation coefficients are -0.30 for offensive consistency, and 0.22 for defensive consistency. That’s not insignificant, at all.
Simply, inconsistent offensive production is bad for winning, while inconsistent defensive production is good for winning.
The offensive piece does make intuitive sense. The more inconsistent a team is, the less predictable the outcome, and therefore which team is “better” matters less. But why is it that defensive inconsistencies are good?
Well, the truth is that most defensive statistics simply capture the other team’s offensive statistics. So a higher “defensive consistency” by runs is really a corollary for opponent’s high offensive inconsistency. Accordingly, it is preferable that defensive stats are more variable.
From a roster construction level, it suggests that teams should put together offensive players to reduce variance. Again, with a caveat that this is while all else remains the same. In baseball, it explains the traditional wisdom about mixing lefties and righties in a batting lineup. It also might mean that pitchers with high variance are undervalued, when they are only judged by their season or career totals.
Is this real? Or a quirk of statistics? Furthermore, should we start to capture such metrics for better understanding of games, players, and teams?
Variance in basketball
Before we go, let’s do a quick sanity check to see whether we might see similar effects manifest in other sports. Of course, I picked basketball :). As most people know, the volume of three-pointers taken have increased significantly over the last ten years or so to take advantage of their efficiency.
But three-pointers are inherently higher-variance shots than two-pointers, owing to their lower percentages. So how would that have affected the outputs vs Pythagorean predictions?
For the traditional Pythagorean predictions with an exponent of 13.91, there is a slight, but noticeable (~-0.15) negative correlation between 3pt shots and the Pythagorean error in wins. Meaning that teams shooting more 3pt shots underperformed their Pythagorean predictions.
Clearly, this doesn’t mean that shooting more 3pt shots are undesirable. On average the impact of scoring more points per shot is going to have a larger impact than the increase in variance. But it’s worth thinking about, and certainly at an individual player evaluation level, their consistency would be worth considering.
All of the above factors that I’ve laid out suggests that consistence materially affects winning.
So then - why is it that in the modern era, where we have statistics for almost anything, statistics don’t incorporate consistence, or variance?
I think it’s time that we either take variance/consistency in its many forms into account, or we start to create new statistics to describe variance.
Eye-catchers
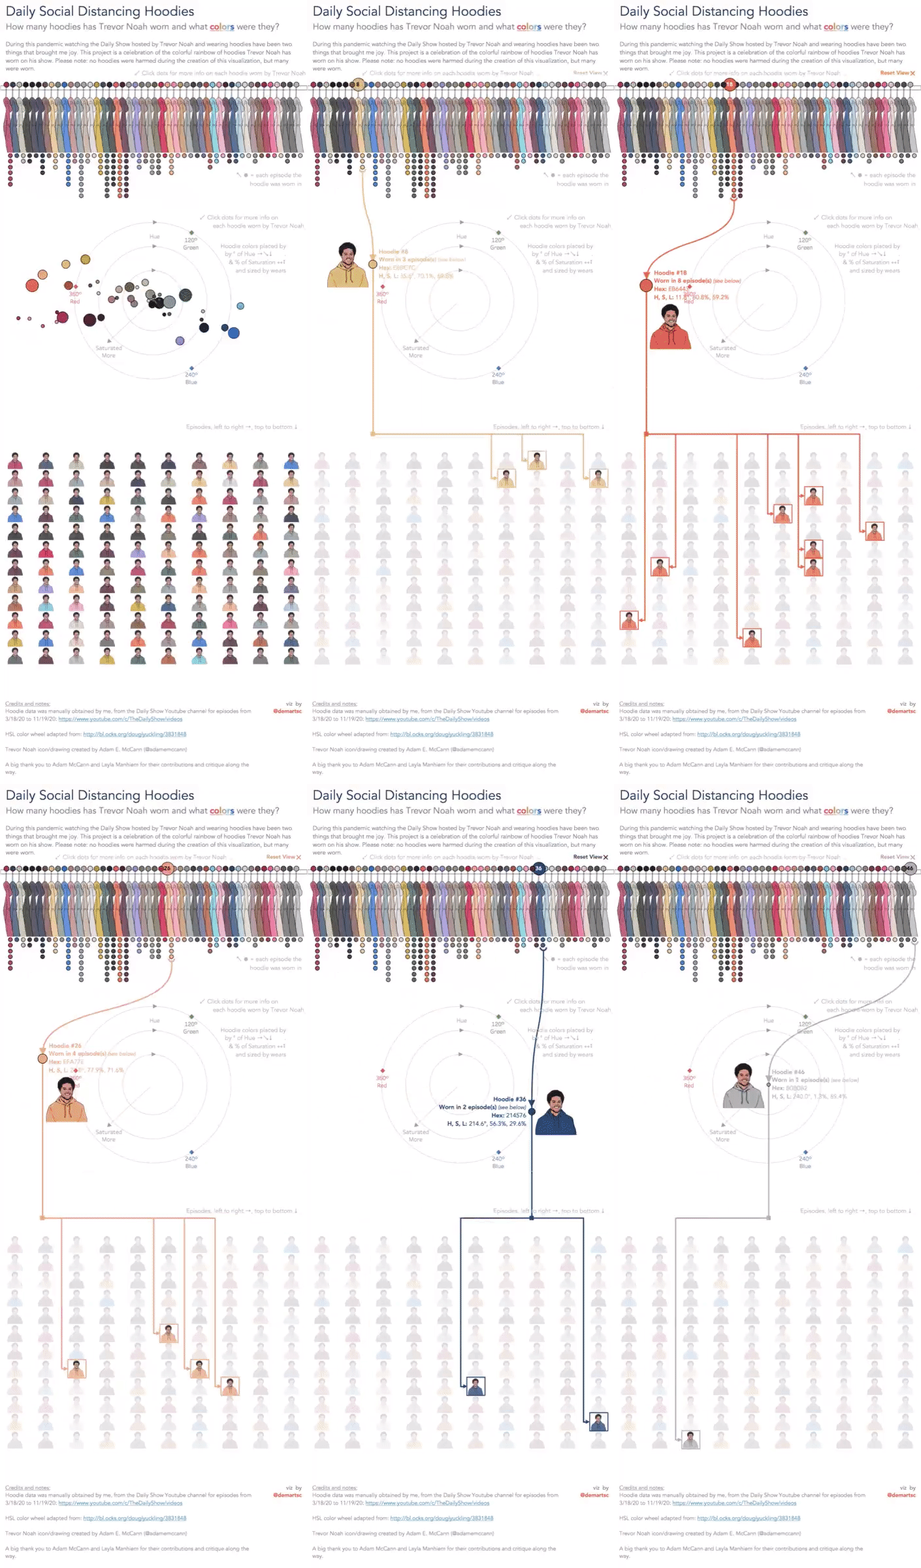
(Almost) 50 shades of Trevor Noah
@demartsc takes us on a journey through Trevor Noah’s closet, as seen on the Daily Show.


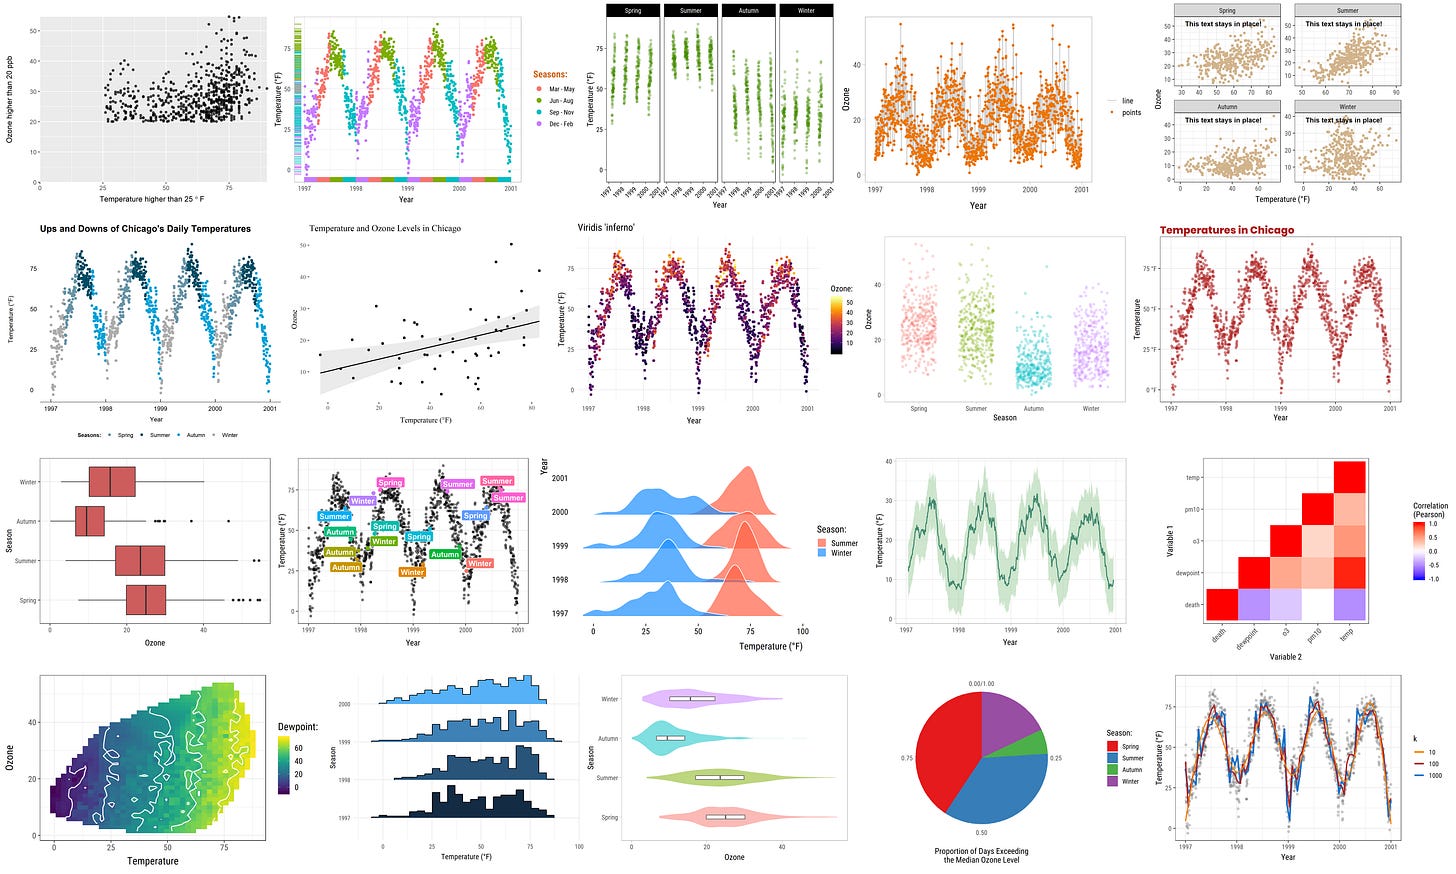
A beautiful ggplot2 tutorial
I am more of a python man myself, but I couldn’t go past this ggplot2 tutorial by Cedric Scherer. If you are an R user (or even if you’re not), please check it out. (Honestly, I’m so often stunned at the quality of the content that is available on the Internet for free.)

Thanks for reading! Don’t forget that you can leave a comment about anything, including requests for articles, feedback or anything else.
JP
If you liked the article, please subscribe:
And share it with others here:


I wonder how this would look in a low scoring sport like hockey or soccer. Similar to basketball, you could compare over and under performance to xG per shot. Do teams with higher average quality of shot per more consistently?