He’s heating up!
Do NBA players believe in the hot hand? How does it affect their actions?
Hi!
It’s been a long couple of weeks - but we’re back. I wanted to talk a little about the “hot hand”, especially as it relates to sports.
If you've ever been to a casino, it’s more likely than not that you’ve seen a crowd around a “hot” roulette or craps player cheering them on.
The hot player, at that moment in time, is a better - no, best, version of themselves, a la Thor with Mjolnir, or Jordan in Game 6. They can't do no wrong. Their poker hand comes back to win from well behind, every roll is a winner, and every bet placed comes through.
You don’t need me to tell you that the reality in these games is more mundane, however. Each event is independent in (most) games of chance, and past results are not indicative of the future. Any perception of a hot streak or a hot hand is just another example of cognitive bias famously termed the “hot hand fallacy”.
But it's not so simple in sports.
Recent research suggests that the hot hand is very real in basketball. (I recently read this great book about it, aptly titled The Hot Hand.) The researchers found that unlike in games of chance, a player was actually more likely to make the next shot after a string of makes than they were likely to after a string of misses.
This is probably due to the fact that players aren't robots and they're going to have bad days and good days, possession of magical hammers notwithstanding. (Who knew that sports involved skill and athletic ability?)
As to how much better? That’s a very difficult thing to measure. Real basketball doesn’t tend to resemble a controlled laboratory environment.
But I wondered could we measure who might be more affected by whether they’ve been making or missing their previous shots? Could we identify the true believers of the hot hand, compared to those mere observers?
So here we use data from the last 3 NBA seasons to see whether there was any discernible impact of a player feeling “hot” or “cold”. A “hot” start was defined as times when a player started by making their first 3 shots, and a “cold” start when starting 0 for 3. The idea being that starting the game “hot” might make them feel invincible, or at least… slightly upgraded.
This is the code snippet for marking whether a player has gone through a hot start or a cold start.
| # Add column for cold/neutral/hot start - based on (n_streak-margin) / n_streak makes or misses) | |
| shots_df = shots_df.assign(start="Unknown") | |
| for pl in players: | |
| logger.info(f"Processing data for {pl}") | |
| dates = shots_df[shots_df.player == pl].date.unique() | |
| for date in dates: | |
| day_filter = ((shots_df.player == pl) & (shots_df.date == date)) | |
| day_df = shots_df[day_filter].sort_values("tot_time") | |
| if len(day_df) > n_streak: | |
| if day_df[:n_streak]["shot_made"].sum() >= n_streak - margin: | |
| shots_df.loc[day_filter, "start"] = "Hot" | |
| elif day_df[:n_streak]["shot_made"].sum() <= margin: | |
| shots_df.loc[day_filter, "start"] = "Cold" | |
| else: | |
| shots_df.loc[day_filter, "start"] = "Neutral" | |
| # take a look at players' shot distances AFTER the hot / cold start | |
| tmp_df = shots_df[shots_df.start.isin(["Hot", "Cold"])] | |
| hot_grp_df = tmp_df[tmp_df.player.isin(players)].groupby(["player", "start"]) |
And after grouping the results and removing the players with small sample sizes, we can generate plots like the following.
Each dot represents a player, where the y-axis shows how many shots they take per game after a hot start, and the x-axis shows shots/game, after a cold start. The marker size shows how many shots they’ve taken in that 3-season span.
(See the interactive version here)
On average, players shoot slightly more after a hot start than a cold one as you might expect. They’re shown to the upper left to the dotted line. And some players such as De’Aaron Fox, Mike Conley and Kristaps Porzingis, will shoot about 30% more after a hot start than otherwise. Whether it’s the team or the player, the hot hand is very real in these cases.
And then there are players at the opposite extreme.
Look at Victor Oladipo and Kyrie Irving far to the right of everybody else. Irving shoots about 25% more after a cold start than a hot one, and Oladipo about 30%. For these players, the cold hand is just another obstacle to overcome. (Is it coincidence that these two star players have historically had some problems with their team?)
For the most part, though, the hot hand is real. Take a look at this distribution. It’s relatively symmetrical, except it is centred at around 0.5 (0.58, actually).
Similar patterns are observed when looking for changes to the average shot distance after a hot/cold start. On average, players’ shots after a hot start is from 0.5ft further than after a cold start.
Draymond Green is the ultimate confidence shooter in this example, where he will shoot on average from 6 feet further out in games after a hot start than in a cold one!
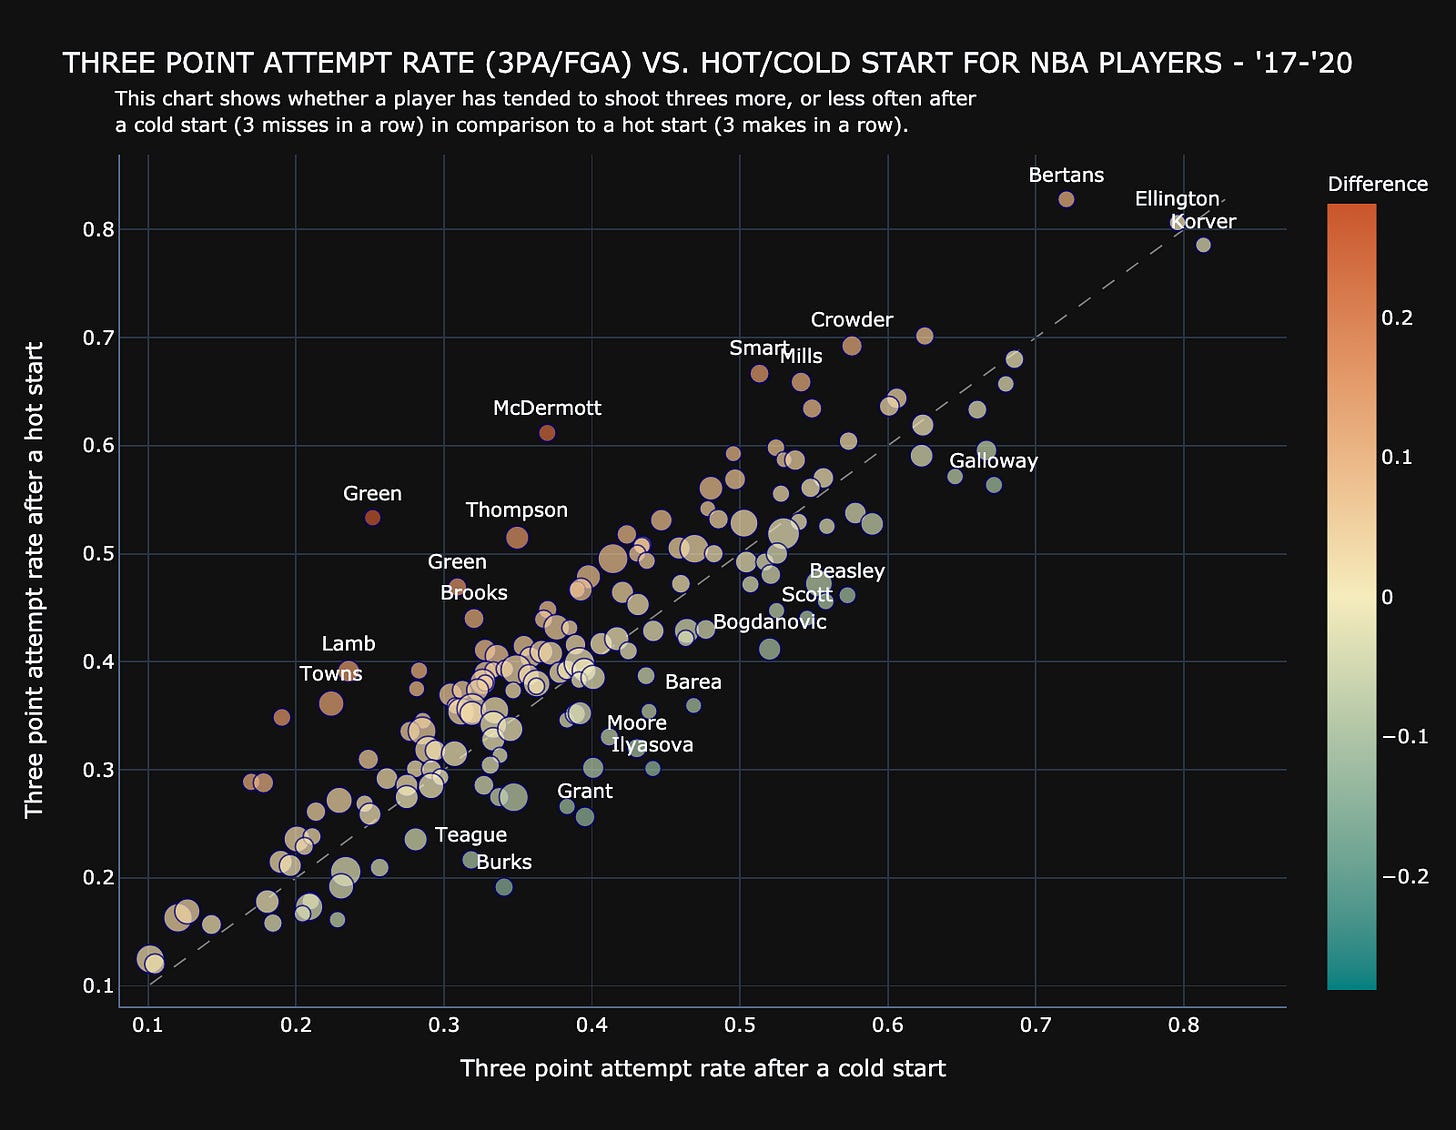
And the three-point attempt rate shows the same results. This data shows us the percentage of shots that are three-pointers, after a hot start vs a cold one.
After a hot start, certain players like Green, Doug McDermott, Marcus Smart and Jae Crowder are far more likely to be bombing away than after a cold one.
Interestingly, players who make their living on threes-like Kyle Korver and Wayne Ellington are not impacted by either a hot start or a cold start, showing metronomic consistency.
All in all, although the extent of the belief seems to be quite different to one another, the data strongly suggests that the NBA believes in the hot hand as a whole. As to whether this is warranted is a whole another issue, but it’s interesting to see different players’ reactions to the phenomenon, including the counter-intuitive ones like Kyrie seeing red when he starts off with a cold streak.
Eye-catchers
I can’t agree more with Maarten. Don’t do it.


Oh, I wrote this a long time ago, and unfortunately it still seems topical.
Lastly, I’m considering including more code content for the data analysis & viz that I show here. If you feel strongly about this one way or another (yay/nay) please leave a comment and let me know!
Otherwise - I wish you a Happy New Year, and here’s hoping for a better 2021.
If you liked the post, you can share the it here:


